21 Feb Week of Feb 13th, 2023
Market Indexes:

Economic Data:
Tuesday: CPI Slows Versus Last Month, But Accelerated On A M/M Basis and Comes In Ahead of “Expectations”
Headline CPI clocks in at +6.4% Y/Y and Core CPI (ex-food and energy) came in at +5.6% Y/Y
**These were slight decelerations versus the December readings of +6.45% Y/Y and +5.7% respectively
**That said, on a monthly basis both Headline at +0.5% and Core at +0.4% beat expectations and accelerated
**All of the major subcategories of CPI were up Y/Y with the exception of Used Cars, which was down -11.9% Y/Y – This served to be a negative contributor of -0.48%
**In terms of positive contributors Owner’s Equivalent Rent accelerated to +7.8% Y/Y and positively contributed +1.87% to the growth of CPI
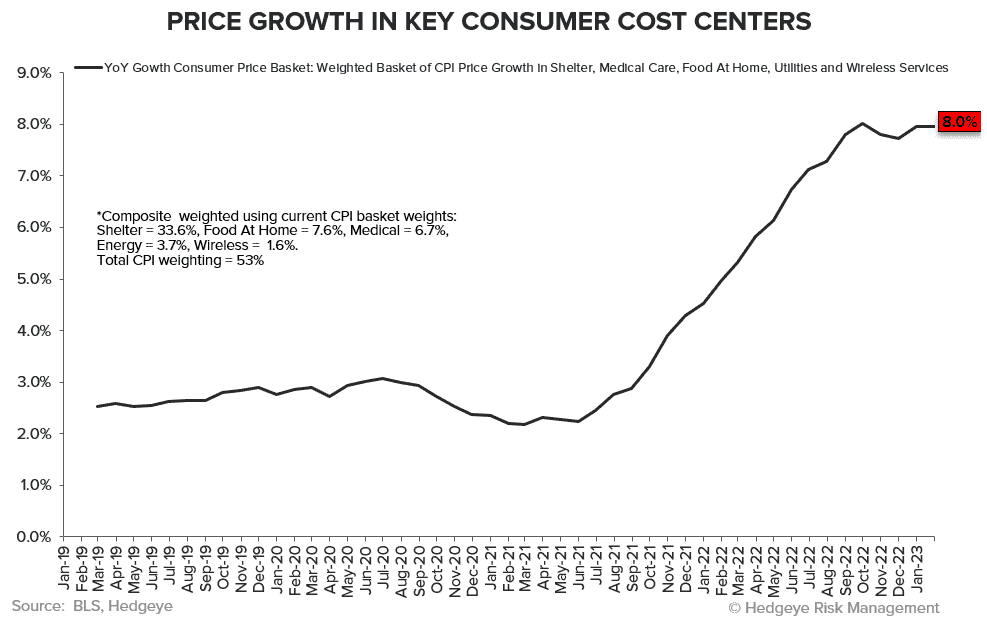
**While there is certainly disinflation in more commodity-related items, price growth in key consumer cost centers (chart below) remains near all-time highs at +8.0% Y/Y

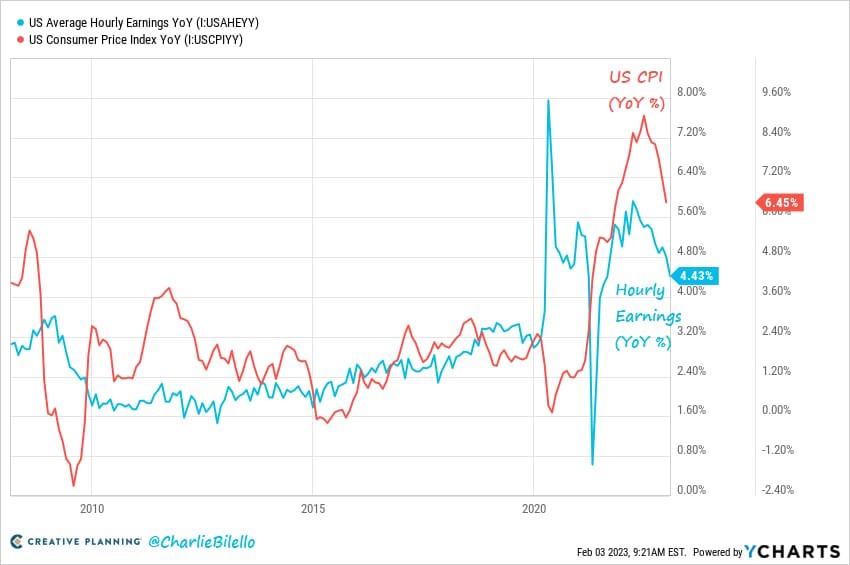
**The implication of inflation running at such a high rate is that real earnings growth remains negative for another month, which makes 22 consecutive months of negative real earnings growth -> meaning wage growth is still underperforming overall inflation
**Along the same lines, Households Expected Income Growth (NY Fed Consumer Survey) logged the largest one-month drop in the series history reflected in the January data

**We had a moderate bump in Redbook Weekly Retail Sales, which came in at +4.9% Y/Y, versus +4.3% in the prior week -> In general, though, this data series continues its trend decline and retail volume is down Y/Y
Wednesday: Blowout Retail Sales Report At +3.0% M/M (Easy Omicron Comparisons Helped)
**As was foreshadowed, Wednesday’s January Retail Sales was stronger than expected coming in at 3.0% M/M and +6.4% Y/Y (an acceleration)
***The big driver was a +25.2% Y/Y and +7.2% M/M increase in food services and drinking places
***Alongside this was a meaningful ramp, sequentially, in motor vehicles, which was up +6.4% M/M
***Electronics and appliances stores continue to be a headwind coming in at -6.3% Y/Y, the only major subcategory that was down Y/Y
***This report is a bit messy because it comps against weak Omicron related comparisons, thus non-store retailers (ecommerce) were a laggard sequentially at +1.3% (versus headline at +3.0%) -> Net-net, while there are some puts and takes this was hawkish report
**Given the recent ramp in mortgage rates (back to YTD highs), no surprise but MBA Weekly Mortgage Applications were down -5.8% W/W
***Re-fi was down -14.3% W/W!!
**On the positive, February NAHB builder confidence jumped 7 points to 42 (highest increase since 2013), though it is only back to September 2022 levels
**January U.S. Industrial Production was flat M/M at 0.0%, this comes after two months of M/M declines -> On a Y/Y basis industrial production continues to see anemic growth up just +0.8%
Friday: PPI Accelerates On A Monthly Basis. Fed Funds Futures Continue To Ramp Higher
**On a M/M basis Headline PPI accelerated to +0.7% (versus -0.2% in December) and Core PPI (ex-Food, Energy and Trade) accelerated to +0.6% (versus +0.2%) -> better than expected
**Conversely, on a Y/Y basis Headline PPI slowed to +6.0% (versus +6.5%), while Core PPI slowed to +4.5% (versus +4.7%)
**The net takeaway is incrementally hawkish given the monthly re-acceleration and better than expected print
**January Housing Starts decelerated from the prior month to 1.309MM, versus 1.371MM -> down roughly ~-4.5% M/M and -20% Y/Y
***While housing starts being down is no surprise given the rapid increase in interest rates over the last year, there is an inflationary aspect to this report since gross housing inventory is near all-time lows
***So, while demand is obviously soft, the lack of inventory is likely to keep home prices “high and sticky”
**The Philly Fed Manufacturing Index for February slowed to -24.3 -> lowest reading since May 2020
***The primary delta was that only 7% of firms reported increases in “current activity” versus 24% in the prior month
***Similar to other regional Fed surveys, we also saw a re-acceleration in prices paid going from 24.5 -> 26.5
**January U.S. Import Prices decelerated to +0.8% Y/Y and Export Prices slowed to +2.3% Y/Y
***This price series is more commodity laden and volatile, but obviously some serious disinflation here


Sorry, the comment form is closed at this time.