

03 Apr Market Indexes:
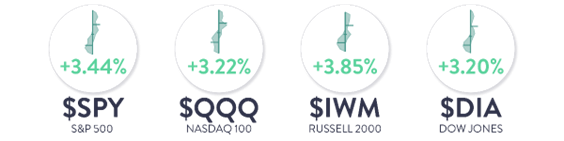
A month-end melt up in stocks to end this chaotic quarter in the markets. We ended Q1 2023 on a strong note, indicating that traders have put the three bank failures and one on the cusp (First Republic Bank), in their rearview as they searched for the new value trade. Money shifted from interest rate sensitive financials into 7 mega-cap stocks which could account for 90% of the S&P 500’s Q1 2023 return.
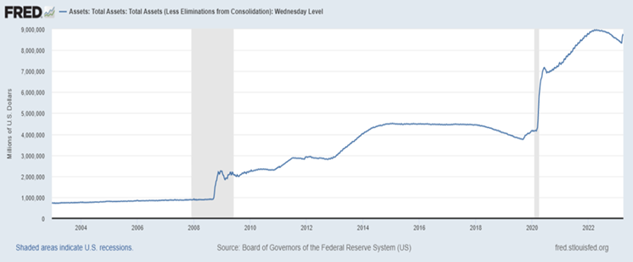
It could also be the fact that they feel they have the Fed on their side again as the Fed Balance Sheet expanded once again to hit $8.7T – undoing 63% of quantitative tightening (QT) in just two weeks. In the past, an increase in the Fed’s balance sheet is typically a green light for stocks. However, we are in uncharted waters here as the Fed has not had to deal with stubbornly high inflation, the potential for a credit risk event and corporate profit recession.
Economic Data:
Monday: Home Prices Continue Their Long Deceleration. Consumer Confidence Ticks Up, While Weekly Retail Sales Tick Down
- U.S. Redbook Weekly Sales remain near their post pandemic lows at +2.8% Y/Y, which is a deceleration from the prior week at +3.2%
- On a volume basis this likely implies volume was down -3 to -4% Y/Y
- Consumer Confidence in the U.S. for March ticked up slightly to 104.2, versus 103.4 in February (revised higher)
- This data series remains well below the trend pre-pandemic of between 120 and 140, but a bounce nonetheless
- January Case-Shiller National Home Price Index was -0.2% M/M and slowed to +3.8% Y/Y
- January U.S FFHA home prices were +0.2% M/M and slowed to +5.3% Y/Y
- On both measures these are new post pandemic lows on Y/Y price increases
- House prices would likely be decelerating faster if it wasn’t for national housing inventory remaining near historical lows of 980K units,
- According to Fed Funds Futures, we are now at a roughly 57% chance of another 25bps hike at the next FOMC rate meeting
- This has increased +6bps from the hike last week
Tuesday: Pending Homes Sales and Mortgage Purchase Apps Continue The Bounce In Housing Data.
Akin to recent housing data points, February Pending Home Sales surprised to the upside coming in at +0.8% M/M, versus estimates for a -3.0% decline.
- On a Y/Y basis pending home sales do remain down some -21% Y/Y
- On the back of this recent housing data, Bloomberg Housing and Real Estate Market Surprise Index has hit the highest level since late 2020
- Obviously, the key catalyst recently has been lower mortgage rates, so from here the rate of change in mortgage will be key in determining the direction of U.S. housing fundamentals
The challenge in getting home prices down meaningfully in the U.S. is inventory, which remains near all time lows on a raw basis
- To that end, the BLS reported that rent prices increased by the most on record in February at +8.8% -> tight market
- That said, and to be fair, other measures of rent are showing a deceleration
Similarly to pending home sales, US MBA Mortgage Purchase Apps were +2% W/W
- That said, this data series here also remains -35% Y/Y
Wednesday: Weekly Jobless Claims Remain Near Cyclical Lows At +198K. GDP Revised Lower, Prices Revised Higher
- U.S. Weekly Jobless Claims were basically flat W/W at +198K, versus +191K
- This data series continues to meander around historical lows and suggests the labor market remains strong-ish
- We have seen some data – job openings, overtime, average work week, etc – that suggests a softening is coming, but for now the hard data is holding
- Similarly, Continuing Claims ticked up ever so slightly to 1.689MM, from 1.685MM
- Although lagging data at this point, with the 2nd revision GDP was revised lower and GDP chain price was revised higher
- Q4 GDP went from +2.7% to +2.6%
- Q4 GDP Chain Price went from +3.5% to +3.9%
- Inversion on the U.S. Yield Curve (10s and 2s) continues to creep lower and is now back at -52bps
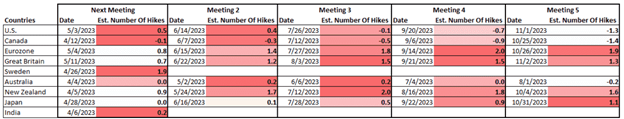
- Meanwhile, Fed Funds futures (table below for global rate expectations) has expectations of one more hike in the U.S., but the potential for rates being cut by the September FOMC meeting is 70% chance
- The Fed staying higher for longer may ultimately be what surprises investors . . .
PCE Slows To +5.0%. Consumer Confidence Decelerates In March To 62.0
- March Michigan Consumer Confidence decelerated from February to 62.0, versus 67.0
- Within the report, Expectations was a noteworthy drop coming in at 59.2, versus 64.7 in February
- Inflation expectations tempered a bit in the short term as well:
1-year inflation expectations slipped to 3.6%, versus 4.1% in February
5-year inflation expectations remained flat with February at 2.9%
- February Core PCE came in lower than expectations and decelerated from January
- On a M/M basis it slowed to +0.3%, versus +0.6%
- On a Y/Y basis it slowed to +5.0%, from +5.3% -> lowest level in more than a year
- So, on the Fed’s preferred measure of inflation, we are clearly getting a slowing, albeit still at high historical levels
- That said, not all versions of inflation slowed. Core Services PCE Ex-Housing actually accelerated to a 5-month high at +4.6% Y/Y.
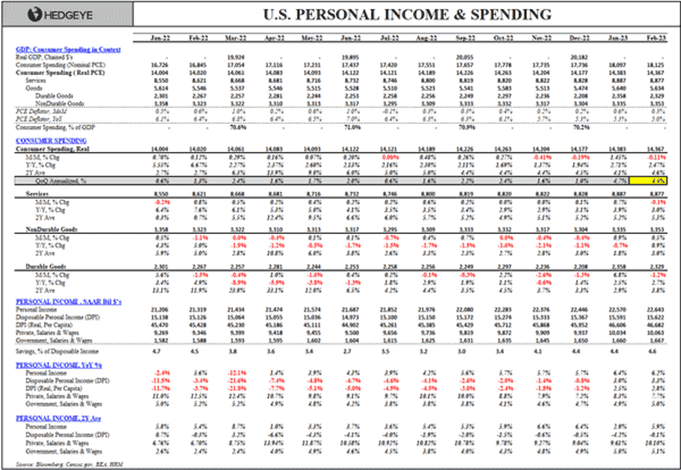
- On Personal Income and Spending (full table below), it was a bit of a mixed bag
- Consumer Spending slowed on a monthly basis to -0.1% M/M and a yearly basis to +2.5% Y/Y
- All subcategories of spending slowed
- Meanwhile, Personal Income remained near 12-month highs at +6.2% Y/Y (though slowed) and Disposable Personal Income re-accelerated to +3.3% Y/Y

Sorry, the comment form is closed at this time.